2021 Google Analytics Benchmarks for Higher Education Websites
We reviewed key analytics metrics for higher education websites throughout 2020 to paint a picture of what to expect in 2021.
At the start of each year, we review website analytics reported through Google Analytics data from a variety of colleges and universities to paint a broad picture of higher education website traffic trends. The data we reviewed spans from December 8, 2019 to December 8, 2020 and includes graduate programs, law schools, liberal arts colleges, universities, and adult programs. Whenever possible, we exclude internal traffic data to ensure the insights accurately convey the behaviors of prospective students, alumni, parents, and any other external visitors.
Spotting analytics trends in an “unprecedented” year
Regardless of the industry, there’s no denying that the COVID-19 health crisis changed the way users engage with content on the web. Just within the first few weeks of the pandemic, streaming services saw a 20% increase in streaming traffic, Zoom's daily users tripled, and in March flight search traffic dropped to 1/4th the volume of the previous year.
Higher education has been no exception to unanticipated shifts in user behavior this year, although nowhere as drastic as the airline or streaming industries. But how did the pandemic change how users engage with college and university websites? Are they spending more time on the site? Viewing more pages? Shifting away from phones in favor of desktop devices, since they’re at home more often? Or has the pandemic not really had much of an impact after all?
Let’s take a look.
Mobile Traffic Loses Ground
Of all the analytics trends we’ve followed since 2014, the year-over-year increase in mobile traffic has been the most reliable. The percentage of users visiting from mobile devices more than doubled between 2014 and 2019, and it looked like mobile use could overtake desktop as early as 2022. That may no longer be the case.
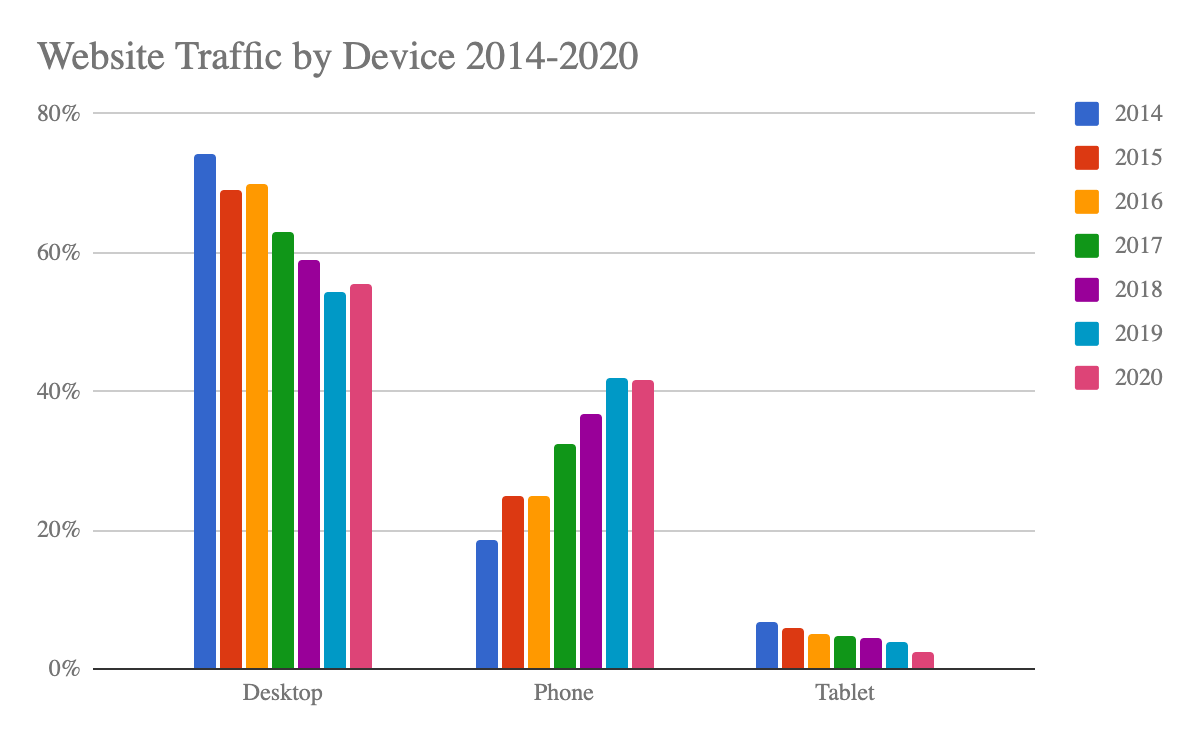
In 2020, the percentage of desktop users actually increased 1.2% — from 54.3% to 55.5%. Rather than growing again, mobile views of higher education websites remained largely flat with the tiniest of dips from 41.8% to 41.5%.
Is that a large shift? Clearly not, but the mere fact that desktop use increased at all is significant. When they were stuck at home with simultaneous access to phones, tablets, and desktop computers, the majority of higher education website users put down their phones and picked up their laptops.
It’s possible (perhaps likely) that once the pandemic is over and life returns to some semblance of normalcy that mobile will continue to trend toward overtaking desktop. However, it will be interesting to see whether this small blip will stall that transition or perhaps even start to reverse it instead.
One thing is certain though, with tablets seeing just 2.4% of overall device traffic this year, it’s probably safe to halt development on your iPad course catalog app.
Visitor Engagement Increases...a smidge
We look at three factors when it comes to gauging visitor engagement:
-
session duration
-
pages per session
-
bounce rate
For the last few years, all three had been trending the opposite direction that you’d want to see. Users were spending less time, viewing fewer pages, and bouncing more frequently. But 2020 saw some promising shifts in two of the three.
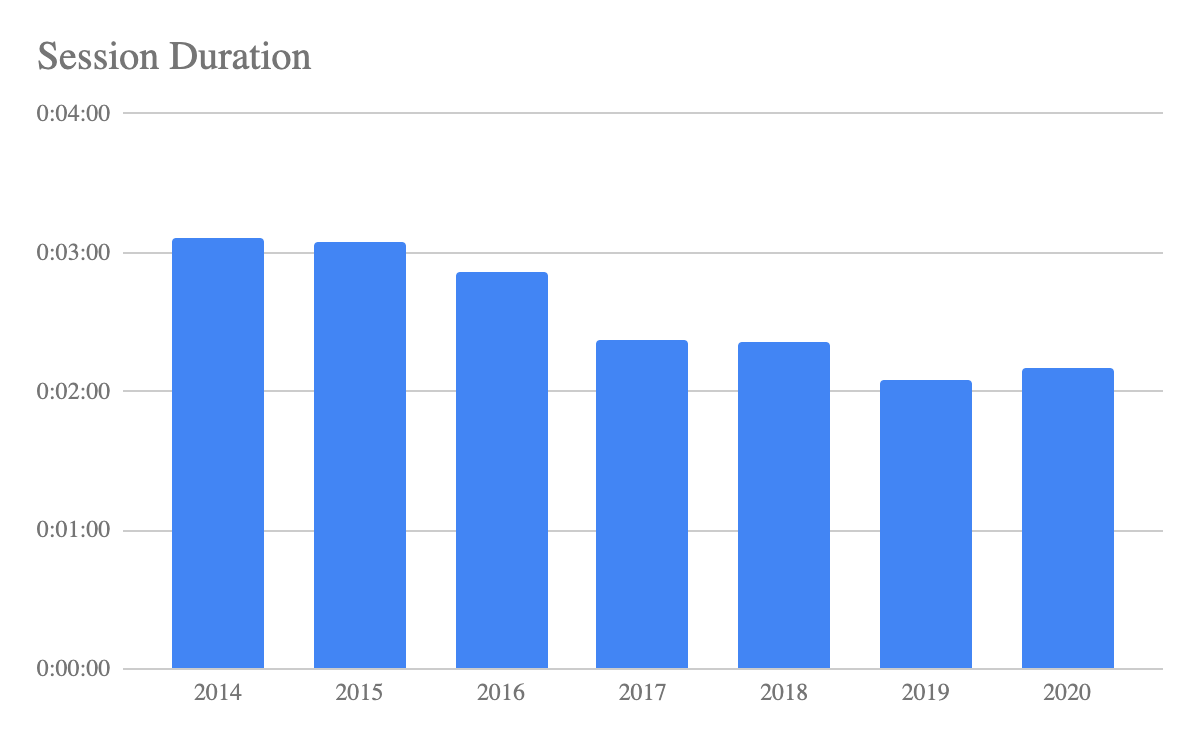
Google Analytics Benchmark: Session Duration 2:10 Minutes
Overall, average session duration increased a few seconds from 2:05 to 2:10 this year. Which tracks with the small increase in desktop traffic, as desktop visits tend to be longer than mobile. Time will tell whether this marks a larger trend change, or if session duration will continue to decline once mobile use starts to increase again.
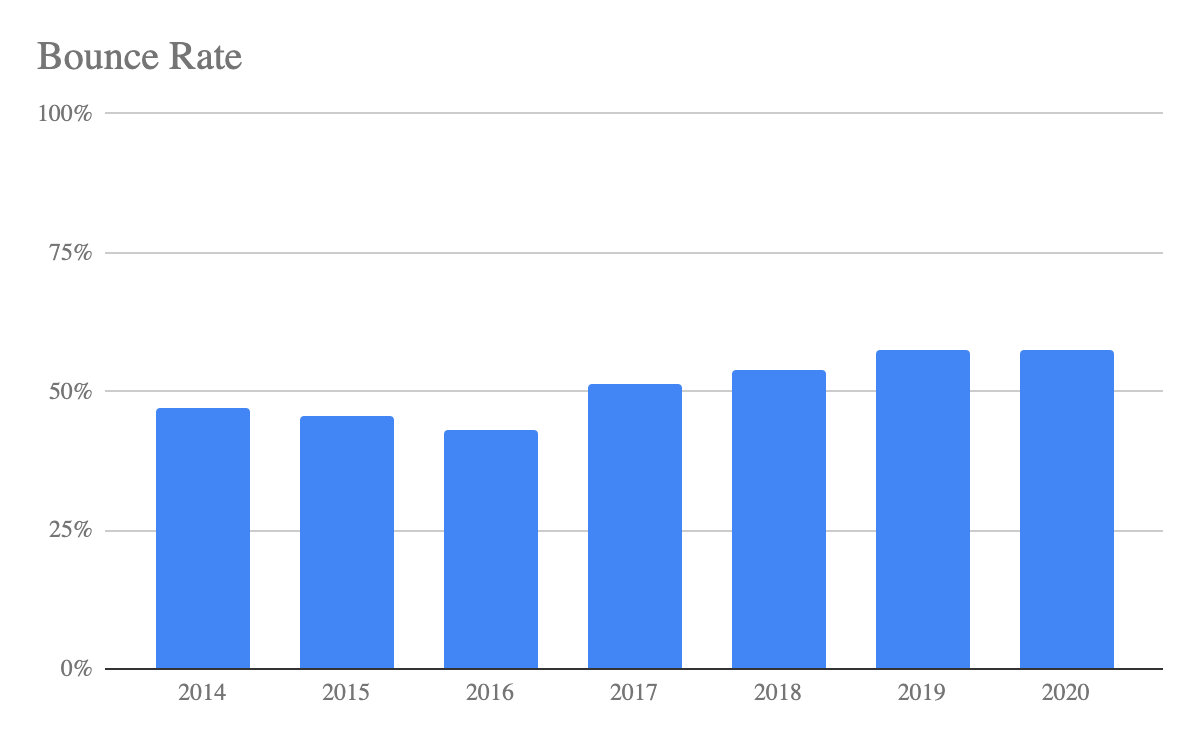
Google Analytics Benchmark: Bounce Rate 57.36%
Bounce rate also saw a minuscule push in the right direction, as the average bounce rate dropped from 57.44% in 2019 to 57.36% in 2020. While it’s a small change, any reduction in single-page sessions is promising to see on an industry-wide scale.
Google Analytics Benchmark: Average Pages Per Session 2.3
Despite the small increase in overall session duration, the average pages per session actually dropped 4% since last year, from 2.4 to 2.3. So even though users are spending slightly more time on higher education sites in 2020, that’s not necessarily translating to more pageviews.

2021 Google Analytics Trends for the Next Year
At face value, comparing the 2019 and 2020 higher education Google Analytics data tells a boring story. After all, nothing much changed. But in a year full of drastic, industry-altering changes and overwhelming uncertainty, the fact that the engagement metrics we track held relatively steady is a remarkable story in and of itself.
Google Analytics provides one snapshot of your content, but if you’re looking to optimize your website to improve conversion it’s important to collect more detailed user insights. Consider one of more of these free tools to optimize your higher education website.
Looking ahead, it will be incredibly interesting to see whether higher education website users revert back to established trends or if the effects of the mass shift to virtual learning and working permanently change how students, parents, alumni, prospects, and parents engage with higher education websites.
Google Analytics Website Benchmarks from Previous Years
If you’re interested in how the key metrics we’ve tracked have changed over the years, you might want to check out some of our previous benchmark blog posts.
2020 Google Analytics Benchmarks for Higher Education Websites
2019 Google Analytics Benchmarks for Higher Education Websites
2018 Google Analytics Benchmarks for Higher Education, College, and University Websites
2017 Website Analytics Report for College, University, and Higher Education Websites