2018 Google Analytics Benchmarks for Higher Education, College, and University Websites
Key website metrics for higher education websites from January 1, 2017 through December 31, 2017.
As we head into 2018, it’s time for our fourth annual report on Google Analytics benchmarks for college and university websites. We reviewed traffic from a wide range of college and university websites — graduate programs, universities, liberal arts colleges, adult programs, and law schools — from January 1, 2017 to December 31, 2017. When available, we looked at only external traffic sources to get the best reads on how prospective students and alumni are experiencing the website.
Website Traffic by Device
The big shift that happened in 2017: mobile phone traffic took off with an increase of 9.5% year-over-year. Mobile phone traffic continues to erode desktop traffic and to chip away at tablet traffic. For the sites we monitored, the range of mobile phone traffic is 21% to 47% with 17% of sites logging over 40% of traffic from mobile phones.
College and University Website Traffic by Device
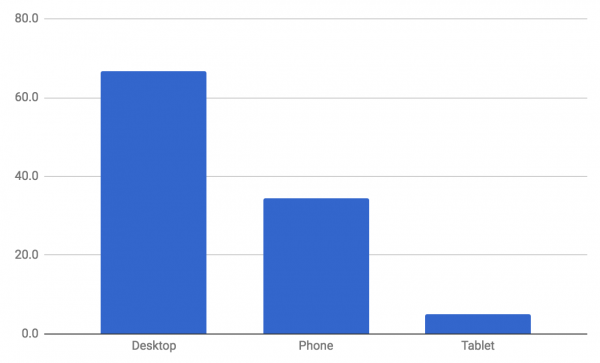
When looking at website traffic by device the 2017 means are:
-
Desktop: 66.7%
-
Phone: 34.4%
-
Tablets: 5.0%
And the 2017 medians are:
-
Desktop: 64.3%
-
Phone: 30.7%
-
Tablets: 5.0%
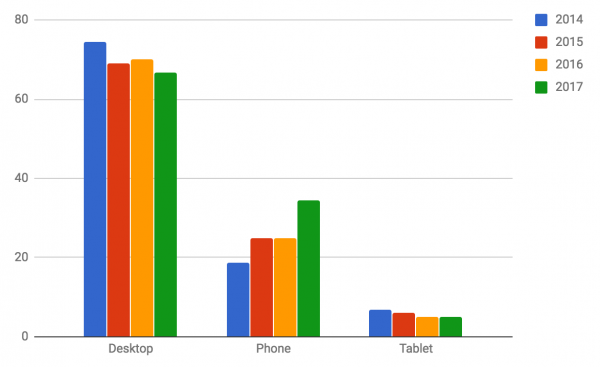
Over the past 4 years, we have seen a rise in mobile phone traffic from 19% to nearly 35%. During the same period we see the decline and stagnation of tablet traffic.
2014-2017 College and University Website Traffic by Device (Average)
Session and Visit Analytics for College and University Websites
When we take a look at some other key metrics – pages per session, bounce rate, and time on site – we see that these statistics have remained fairly consistent over the past 4 years.
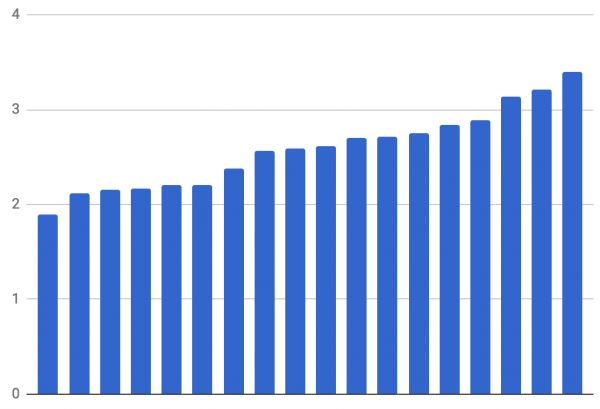
- Pages per session (average): 2.74 pages
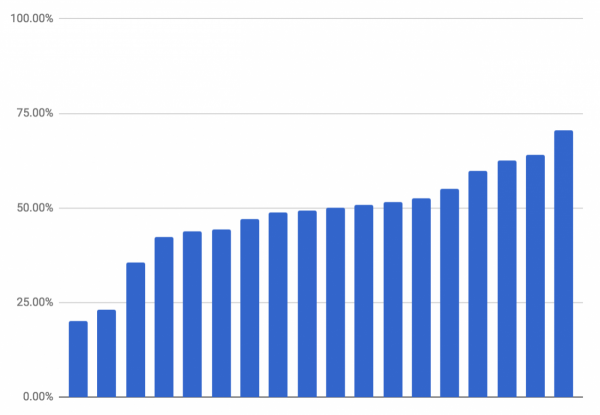
- Bounce rate (average): 51%
- Time on site (average): 2:31 minutes
Pages Per Session – College and University Website Traffic
This graph shows a range of the sites that we monitored (i.e., each bar is an individual site). The vertical axis is the number of pages visited per session.
Average Bounce Rates – College and University Website Traffic
This graph shows a range of the sites that we monitored (i.e., each bar is an individual site). The vertical access is the bounce rate presented as a percentage of total traffic.
Key Takeaways
College and universities have about 2.5 minutes and 2-3 pages to engage prospects. And as mobile phone traffic increases, marketing groups need to ensure that their websites are optimized for mobile – this includes making a responsive website, decreasing and focusing content, and ensuring that main calls to action are mobile friendly.