2020 Google Analytics Benchmarks for Higher Education Websites
Here is our review of 2019 - 2020 website analytics data from a variety of colleges and universities to paint a broad picture of higher education website traffic trends.
Get the updated 2021 report with new data.
At the start of each year, we review website analytics data from a variety of colleges and universities to paint a broad picture of higher education website traffic trends. The data we reviewed spans from January 1, 2019 to December 15, 2019 and includes graduate programs, law schools, liberal arts colleges, universities, and adult programs. Whenever possible, we exclude internal traffic data to ensure the insights accurately convey the behaviors of prospective students, alumni, parents, and any other external visitors.
Mobile Traffic Continues to Rise
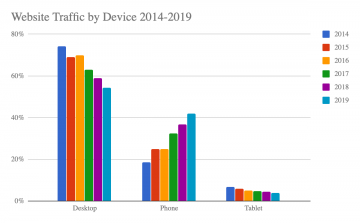
When we first began tracking Google Analytics data for higher education in 2014, optimizing your site experience for the desktop user just made sense. Back then, around three out of every four users were still tethered to a desktop device, and mobile use accounted for less than 20% of traffic. Even two years later in 2016, the data still skewed heavily in favor of the desktop user, at 70%. But in the last three years, that trend has started to shift — rapidly.
For 2019, mobile traffic continued to eat into desktop use, increasing from 36.6% in 2018 to 41.8% of traffic in 2019 (a 14.2% increase), while desktop use declined nearly 8%. Desktop is still the preferred medium for the majority of users (54.3%), but we did encounter a handful of schools where mobile use is actually more prevalent than desktop — a first in six years of tracking.
As with desktop use, tablet traffic is also continuing to wane. In 2019, just 3.9% of higher ed website traffic can be attributed to tablets — an 11% drop from what was already a relatively insignificant 4.4% in 2018.
Visitor Engagement Holds Steady
Many schools focus on the total number of site visitors when gauging the effectiveness of their site, but total site visitors is only part of the equation. What’s more important is audience engagement. How long are users staying on your site? How many pages are they viewing during their session? And how frequently do they abandon (or bounce from) your site after a single pageview?
In this regard, there’s good news and there’s bad news for higher education based on last year's data.
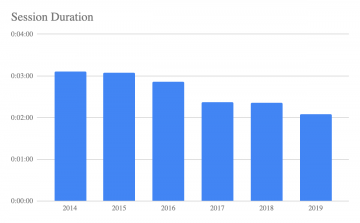
In 2017 and 2018, session duration held steady at around 2:21 minutes. In 2019, the average session duration dropped a full 16 seconds to 2:05. This change can be accounted for — at least in part — by the increase in mobile traffic. Mobile visits are shorter, and the decline in session duration tracks closely with the rise in mobile use. This trend creates a difficult problem to overcome for many colleges and universities, as it leaves them with less time to engage with students and drive home the messaging that’s most important for their school. But while it can be challenging, there are a number of steps you can take to capture the attention of mobile users.
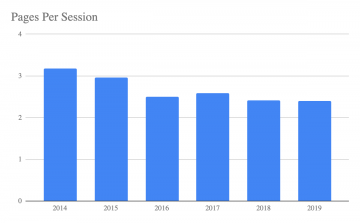
While session duration dropped, the number of pages per session remained nearly identical to last year at an average of about 2.5 pages per session. Although that number is still significantly lower today than it was in 2014 when it was over 3 pages per session.
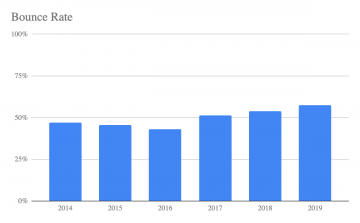
In the past, bounce rate has been a metric where higher education websites have performed quite well — but that could be changing. For content-heavy sites, a bounce rate between 40% to 60% is generally considered “good.” In the last six years, the average bounce rate for higher ed websites has risen from 47% in 2014 to 57.44% in 2019. This is another area where increased mobile use may be the most likely explanation. Mobile users generally have higher bounce rates, particularly when the page isn’t optimized for mobile devices.
2019 Higher Ed Website Analytics Data: What Does This All Mean?
The most important and undeniable takeaway from the data is this: higher education website users and their behaviors are changing. But as we all know, change isn’t always a bad thing.
From speaking directly with prospective students, Gen Z strongly prefer a site experience that’s as good (if not better) on mobile as it is on desktop. By focusing more attention on the mobile user experience, colleges and universities can differentiate themselves and elevate their position. With that in mind, stepping up your school’s SEO efforts becomes increasingly important as site visitors move away from desktop devices in favor of mobile. More than half of all Google searches now take place on mobile devices, and search rankings can vary dramatically between desktop and mobile.