2017 Website Analytics Report for College, University, and Higher Education Websites
A breakdown of browsing data in higher education spanning from January 1, 2016 through December 31, 2016.
“How does our site compare to our peers?” This is one of the most common questions we get from our clients. To help answer it and to benchmark your site, we’ve compiled the analytics on a set of higher education websites to understand the current browsing behaviors. This data captures browsing behavior between January 1, 2016 and December 31, 2016.
Tablet Traffic Still on Downward Trend for Higher Education Websites
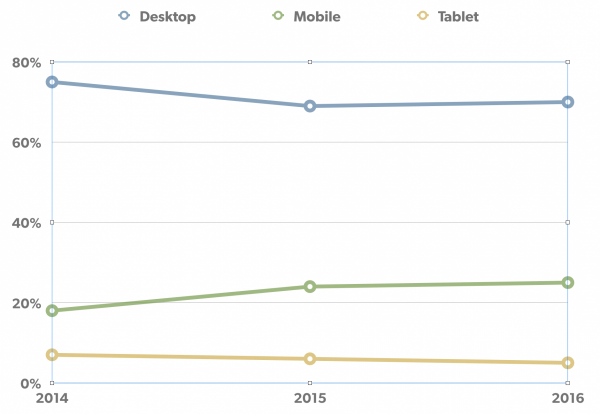
For the second year in a row, tablet traffic saw a slight drop of about 1% on average to about 5% of total traffic. However, on some sites we were seeing tablet traffic as low 3%.
Overall we are seeing very little change in device usage. For the 2016 reporting period, we found traffic by device to be:
-
70% desktop
-
25% mobile
-
5% tablet
Looking back over the past three years, we see that the big shift to mobile viewing came in 2014 following the release of the iPhone 6.
Website Visit Analytics – Remarkably Unchanged
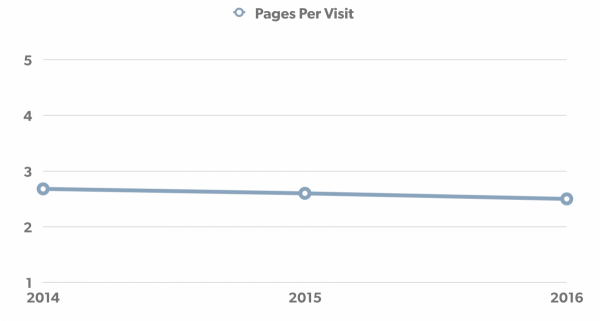
Visits to college and university websites remain under three minutes. The average visit is 2.86 minutes with visitors viewing an average of 2.5 pages. Based on our user research we see that people typically spend about one minute reading a page in detail. The close correlation between visit time and number of page views implies that users are engaged with the content.
When we filtered the traffic down to just visits from outside the schools, we saw no significant change in the results.
Prospective Students Website Browsing Behavior Analytics
To hone in on the browsing activity of prospective students, we filtered the site activity to show data of only visitors that completed admissions calls to action: request information, campus visit sign-up, or application.
By looking back across the site traffic, we found that prospective students read three to five times as many pages right before completing a “transaction” that would increase their engagement. In other words, before filling out an online form to further engage, these visitor are reading 8-15 pages and spend 8-15 minutes on the website.
What are they looking at? We were surprised to discover that they are looking at content across the site – mission, values, president’s profile, admissions details, and academic program.
Take Aways for Your Website Redesign
-
Responsive design is a must. It is critical to deliver a full-featured mobile experience. When testing and designing, the focus should be on the mobile phone experience rather than the tablet experience.
-
Strive for direct and clear navigation. With such short visits, it is critical to have a streamlined information structure with clear, direct labels.
-
Plan for cross linking. To extend visit times, provide cross links within the running text. However, make sure that these links are relevant and are logical next steps for a prospective student.