
2023 Google Analytics Benchmarks for Higher Education Websites
We reviewed key analytics metrics for higher education websites throughout 2022 to paint a picture of what to expect in 2023.
At the start of each year, we review website analytics reported through Google Analytics data from a variety of colleges and universities to paint a broad picture of higher education website traffic trends. The data we reviewed spans from January 1, 2022 to December 1, 2022 and includes graduate programs, law schools, liberal arts colleges, universities, and programs for adult learners. Whenever possible, we exclude internal traffic data to ensure the insights accurately convey the behaviors of prospective students, alumni, parents, and any other external visitors.
Another Year of Benchmark Stability
In last year’s analysis, as well as in our analysis in 2020, we saw an undeniable flattening in nearly all of the metrics we track — bounce rates, pages per session, session duration, and devices. Which left us asking a very reasonable question: was the COVID-19 pandemic shifting higher ed website user behavior?
While it’s certainly possible that some data may have been impacted by the pandemic in 2020 (e.g., an increase in desktop traffic from users browsing from home), that possibility became less likely in 2021 as much of the world began to return to a relative state of normalcy. And looking at the data from 2022, a year where the vast majority of Americans felt comfortable returning to pre-pandemic activities, it’s becoming even more clear that the recent stability in the metrics we track has little to do with the COVID-19 pandemic.
Mobile and Desktop Remain Locked
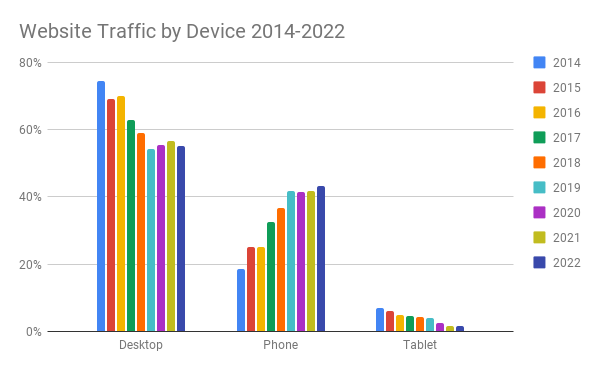
While desktop traffic still makes up the majority of all higher ed website traffic (55.2%), this year saw the highest percentage of mobile visitors (43.2%) since we started tracking all the way back in 2014. However, that’s still only a modest increase from its previous high of 41.8% in both 2019 and 2021. There may be a time in the not too distant future where mobile eclipses desktop use, but even if it does, it certainly looks like there will be a relatively even split between mobile and desktop for many years to come.
Meanwhile, tablet use continued to fade into obscurity, accounting for just 1.6% of all higher ed website visits in 2022.
With mobile and desktop traffic making up such an even split of website traffic, the ability to provide users with a site experience that’s as seamless on mobile as it is on desktop has never been more important.
User Engagement Dips Slightly
We look at three factors to gauge visitor engagement, although that will change next year due to Google’s transition from Universal Analytics to Google Analytics 4 (GA4) (more on that later):
- session duration
- pages per session
- bounce rate
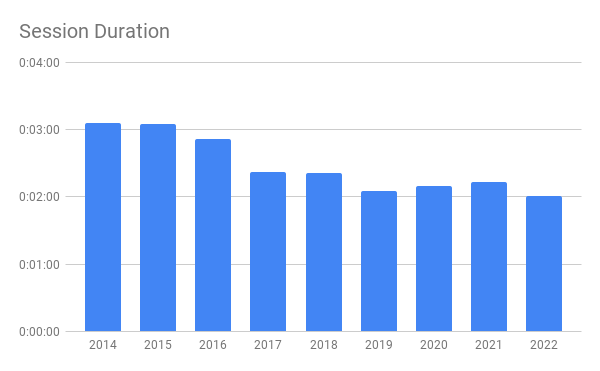
Google Analytics Benchmark: Session Duration 2:01 Minutes
At just a hair over two minutes, session duration dipped to its lowest level since we started tracking back in 2014 — a 9% drop from 2021. It’s an engagement metric that has dropped significantly since higher ed site visitors were averaging more than three minutes per session eight years ago, but also one that’s meandered up and down a bit in the 2:01 to 2:22 range in recent years.
While we generally like to see users spending more time on site, this drop isn’t necessarily anything to be alarmed about.
Google Analytics Benchmark: Bounce Rate 55.19%
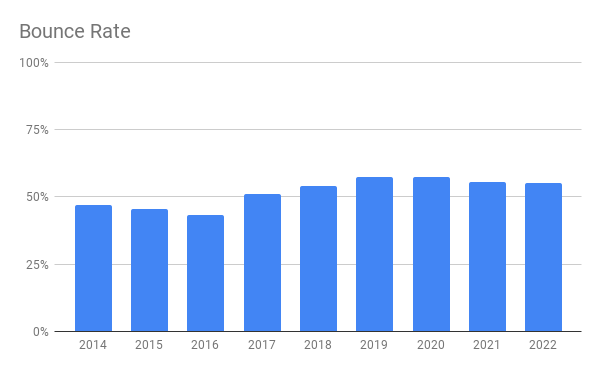
In a year where metrics remained shockingly stable, bounce rate somehow managed to stand out in regards to just how little it changed. Bounce rates dropped just .5% between 2021 and 2022, and haven’t really seen any significant movement since 2017 when they jumped from 43.20% to 51%.
Google Analytics Benchmark: Average Pages Per Session 2.3
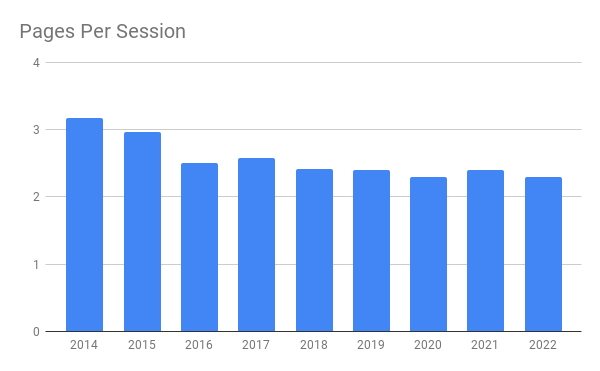
Pages per session ended 2022 on the low end of the 2.3 to 2.6 range that it’s remained within since 2016. Similar to session duration, it’s a metric that would ideally be trending up year over year, but the modest 4% drop from 2021 isn’t anything to panic over.
Google Analytics Trends for 2023
Next year is going to be a very exciting year for higher ed Google Analytics benchmarks. Not because we’re expecting any major shifts when it comes to visitor behavior though. Quite the contrary; device usage and user engagement are unlikely to make any dramatic shifts in the coming year. What’s changing instead will be the way we measure visitor behavior with Google’s transition from Universal Analytics to Google Analytics 4.
Some of the metrics we track will still be relevant, but for others, we may not be able to provide an apples to apples comparison year over year. For example, in Universal Analytics, bounce rate is defined as the “percentage of single page sessions in which there was no interaction with the page.” GA4, however, measures bounce rate as the “percentage of sessions that were not engaged sessions (e.g. someone visited and viewed content on your homepage for less than 10 seconds, and then left without triggering any events or visiting any other pages or screens).”
GA4 will provide exciting opportunities for how higher education marketers measure visitor engagement, and how we determine which data points are most valuable when setting benchmarks. The deadline to transition to GA4 is currently set for July 1, 2023. However, the sooner you can start the transition process the better. If you think you may need help making the switch, OHO’s talented team of strategists can help guide you through the process.