
2022 Google Analytics Benchmarks for Higher Education Websites
We reviewed key analytics metrics for higher education websites throughout 2021 to paint a picture of what to expect in 2022.
At the start of each year, we review website analytics reported through Google Analytics data from a variety of colleges and universities to paint a broad picture of higher education website traffic trends. The data we reviewed spans from January 1, 2021 to December 1, 2021 and includes graduate programs, law schools, liberal arts colleges, universities, and adult programs. Whenever possible, we exclude internal traffic data to ensure the insights accurately convey the behaviors of prospective students, alumni, parents, and any other external visitors.
Google Analytics Benchmarks Continue to Flatten
Between 2014 and 2019, a number of reliable trends emerged in higher education website traffic. Session durations tended to decrease, as did the number of pageviews during those sessions. Year over year, mobile gradually chipped away at desktop use to the point where mobile seemed poised to overtake desktop. But in 2020, nearly all of the metrics we track remained fairly static from the year before, instead of continuing the trends that had been so reliable in previous years.
At the time, we speculated that the unexpected data could be attributed to changes in behavior during the COVID-19 health crisis. For example, desktop might have seen a temporary increase in traffic due to visitors spending more time at home. While that may still be the case, after reviewing the data from 2021, it seems that the industry benchmarks we track may well be settling into some degree of stability despite the pandemic — not because of it.
Desktop Traffic Remains Steady
As was the case last year, desktop saw another modest increase in 2021, making up 56.6% (+1.1%) of total traffic compared to Mobile’s 41.8% (+.3%). Both increases came at the expense of tablet traffic which dropped to 1.6% from 2.4% in 2020.
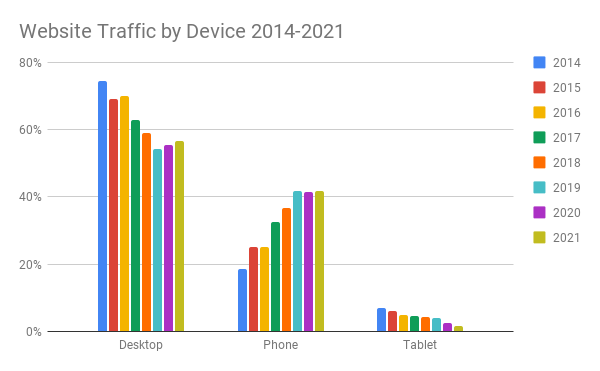
Last year we speculated that the uptick in desktop traffic might be temporary, and would drop again once COVID-19 restrictions eased and higher ed website visitors spent less time at home. Yet desktop use didn’t decline in 2021, as we thought it might.
Instead of a temporary increase caused by the pandemic, it would appear that desktop and mobile traffic may instead have reached a state of equilibrium. Instead of mobile use gradually increasing to supplant desktop, we may see the two continue to hover around 50% of higher ed website traffic, with users performing complex tasks — like applying for admission — on desktop devices, and reaching for their phones for simpler things — like browsing programs.
Visitor Engagement Remains Consistent
Each year, we look at three factors when it comes to gauging visitor engagement:
-
session duration
-
pages per session
-
bounce rate
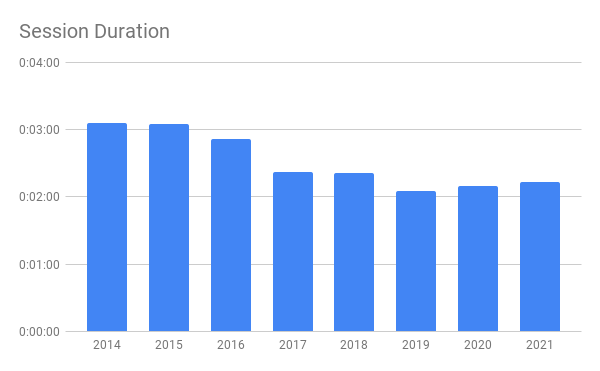
Google Analytics Benchmark: Session Duration 2:13 Minutes
While higher education site visitors in 2014 and 2015 averaged more than 3:00 minutes per session, that number has remained within a 17 second range (between 2:05 and 2:22 minutes) since 2017. This year was no exception, with users spending an average of 2:13 minutes per session.
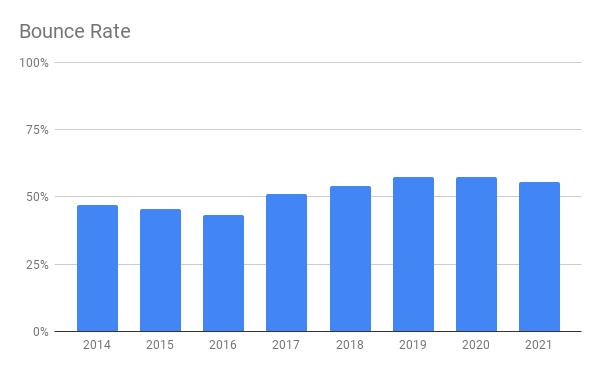
Google Analytics Benchmark: Bounce Rate 55.69%
Bounce rate is another metric that has remained relatively flat in the last few years, and it continued to fluctuate only incrementally in 2021. The average bounce rate dropped from 57.36% in 2020 to 55.69%. While the decline itself might not be substantial, a sustained plateau or even a decline in this metric would be great to see. Bounce rates in the mid 50% range or not that worrisome, but higher education websites do remain on the high end of average.
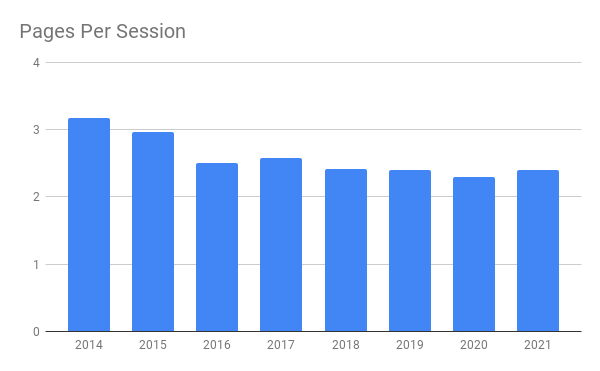
Google Analytics Benchmark: Average Pages Per Session 2.4
Of the engagement metrics we track, pages per session is the most unchanging. Some years it bumps up a bit, others it drops some, but it’s remained within a 12% range (2.3 to 2.58) since 2016. This year it ticked up slightly to 2.4 pages per session, up from 2.3 in 2020.
2022 Google Analytics Trends for the Next Year
While 2021 may not have seen any massive upheaval in higher education Google Analytics benchmarks, there’s a lot to be excited about with the amount of stability we’re seeing. It’s a lot easier to plan content when users start to behave predictably.
Looking ahead to 2022, it’s safe to assume that you’re going to have close to an even split between desktop and mobile users, with slightly more visits from desktop; almost nobody is going to browse from a tablet. When they visit your site, they’re very likely going to spend between 2:00 minutes and 2:20 minutes engaging with your content across ~2 pages. Around half of them are going to abandon your site after viewing just one page.
If you’re finding that your own site content is performing significantly worse than these benchmarks, it might be time to consider performing a content audit to help you identify problem areas and develop a plan to shore up your content.
Google Analytics Website Benchmarks from Previous Years
If you’re interested in how the key metrics we’ve tracked have changed over the years, you might want to check out some of our previous benchmark blog posts.
2021 Google Analytics Benchmarks for Higher Education Websites
2020 Google Analytics Benchmarks for Higher Education Websites
2019 Google Analytics Benchmarks for Higher Education Websites
2018 Google Analytics Benchmarks for Higher Education, College, and University Websites
2017 Website Analytics Report for College, University, and Higher Education Websites