
Measuring ROI of Paid Advertising in Higher Education
We'll help you understand what to measure, how to measure it, and how to apply what you've learned to future digital marketing campaigns.
For higher education digital marketers, understanding the return of marketing investments is critical. To demonstrate to stakeholders the value of paid media and organic campaigns, marketers must establish two criteria before launching a campaign:
- A clear, agreed-upon vision and measure of success
- An established process for measuring and reporting on tangible metrics of achievement
Digital marketing tracking tools provide a diverse set of metrics which are beneficial for garnering a multi-faceted view of campaign performance. However, if viewed in isolation, these metrics provide minimal value. These metrics must be viewed in the context of clearly defined goals and KPIs.
In this article, we’ll detail a path to defining KPIs and methods for reporting against these KPIs. We’ll help you think about:
- What does success look like?
- How do you measure it?
- What metrics will demonstrate the marketing and enrollment goals of your brand?
You Can’t Measure What You Don’t Define
When creating a paid advertising campaign, it is crucial to set goals that have a measurable action associated with them — you can’t measure what you don’t first define.
Step 1: Set digital marketing campaign goals
Let’s start with goals. For an enrollment campaign this might mean your goals are one of the following:
- Increasing brand/name recognition
- Increasing interest (including inquiries, visits, or applications)
- Increasing deposits
Let’s take an example. If your school doesn’t have strong search visibility or name recognition, you may want to set a campaign goal around brand awareness and interest in target areas. For brand awareness, you will want to measure impressions and brand lift.
If your goal is to increase interest, you would want to measure metrics such as clicks, organic searches, page views, and content engagement.
Step 2: Find a benchmark in your data
For each metric that you choose to measure, you’ll want to dig into your current data so you have a benchmark to compare your new campaign against. Without knowing your current performance, the data you collect in the new campaign will not be contextualized and will not be beneficial in tracking KPIs or identifying trends. Even for soft KPIs that don't necessarily have hard numbers to track, it is still necessary to understand and document your averages or what is considered “normal” for your brand, so you will be able to identify success.
Step 3: Identify Industry Benchmarks
Success in paid advertising can vary greatly from one school to the next. Factors such as prestige, program offerings, budget, geographic location, and market competition can all affect what your cost per acquisition and overall marketing metrics may look like. Despite these variances, there are a few higher education industry benchmarks that are beneficial to make note of for paid media campaigns:
- Google Search
- Click-Through-Rate (CTR): 3.58%
- Cost-Per-Click (CPC): $3.70
- Conversion Rate (CVR): 3.39%
- LinkedIn
- Click-Through-Rate (CTR): 0.56%
- Cost-Per-Click (CPC): $5.58
- Conversion Rate (CVR): 0.50%
- Facebook / Instagram
- Click-Through-Rate (CTR): 0.55%
- Cost-Per-Click (CPC): $2.11
- Conversion Rate (CVR): 3.26%
- Google Display Network
- Click-Through-Rate (CTR): 0.53%
- Cost-Per-Click (CPC): $0.47
- Conversion Rate (CVR): 0.50%
How to Track Success
After you have defined your KPIs and established a baseline of your current metrics, you are ready to begin leveraging tracking tools to measure metrics that are relevant to your campaign goals. Here are some options that provide the most valuable insights for paid campaign performance.
UTM Tracking
UTM tracking is a necessity. UTMs are tagged links that can be used across all paid online ads which contain information that help you track on-site behavior and action KPIs. By setting goals and events, you extract more insightful data around the actions users are taking and where they are taking them.
Default KPI Reporting
Most ad platforms such as Facebook/Instagram, LinkedIn, and Google provide default reporting on KPIs such as impressions, clicks, CTR, and CPC. However, to track conversions to your site, we suggest setting up custom conversions by placing pixels on site through Google Tag Manager.
CRM Reporting
Through CRM Integration, you can establish lead attribution reporting, unique forms, and application and enrollment status tracking.
Reporting and Sharing Insights from Digital Marketing Campaigns
Now that you have benchmarks and reporting coming in from the enrollment marketing campaigns, it’s time to decide which metrics to share with your stakeholders. From bounce rates to queries to traffic percentages, there are many different digital marketing metrics that can be tracked, analyzed, and reported on. While a vast pool of metrics offers great potential for insights, not all of these metrics will be relevant to your current campaign goals.
There are three primary goals for creating insightful reports:
- Report on KPIs by comparing your performance to established benchmarks
- Look for broader campaign impacts as it relates to user behavior
- Look for insights into audiences, campaign assets, site content, and more
When measuring broader impact and looking for insights, review site engagement and traffic metrics as well as audience attributes to collect valuable information that can help inform your landing page or targeting strategy.
Google Analytics
When leveraging a reporting tool, you will want to consider what style of reporting is best suited to your marketing team. Google Analytics is a tried and true reporting tool that lets you drill down into detailed metrics such as goal completions, traffic by channel, pages per sessions, device metrics, traffic by location, and more. While more rudimentary, spreadsheets have data integration capabilities that make them suitable tools for tracking and reporting on wins and losses.
Developing Campaign Dashboards
If you're looking for a more visual representation of your data, consider dashboards. Platforms such as Google Data Studio and Tableau allow you to customize your reporting by leveraging the metrics most relevant to your campaign goals and displaying them in a digestible and aesthetically pleasing format. Here’s one example of a dashboard that we’ve put together for one of our clients:
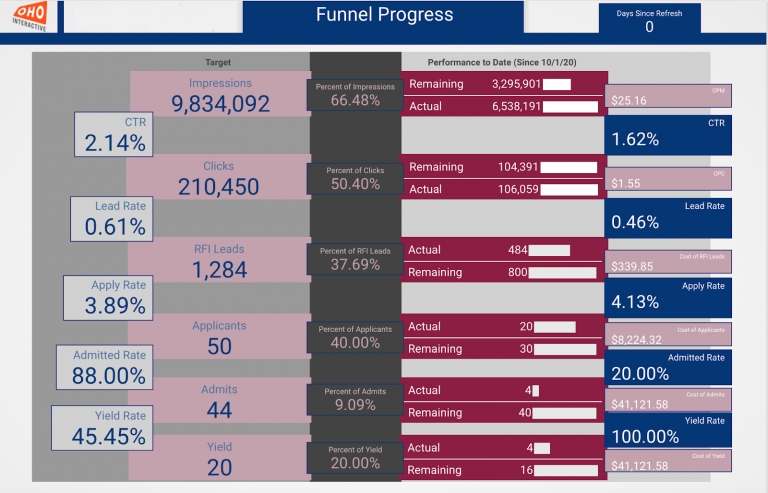
Dashboards are great because they are automated and provide real-time metrics that make it simple to quickly monitor campaign success and share insights with your team. Given the time and effort you put into creating successful paid advertising campaigns, you’ll want to have a reporting toolkit that makes it easy to share your success.
What is Your Digital Marketing ROI? A Final Reminder.
Remember, when looking to calculate a return on investment, it is important to keep in mind that the total investment is not just the paid media budget — it is the combination of lead nurturing efforts, webinars, SEO, content, design, etc. — everything it takes to drive enrollment. Your ROI is not just reflective of your paid media spend, but rather the bigger picture of your holistic marketing efforts.
Olivia Abele, Digital Marketing Analyst, contributed to this blog post.