Marketing Dashboards for Colleges, Universities, and Higher Education
The two types of marketing dashboards in higher education, their key benefits, and how you can get started using them.
Once a year. Before board meetings. Sometime in the summer.
Let’s face it, reporting just doesn’t happen that often. It’s hard to know which data to collect. It’s all tied up in different systems. And, the process of pulling it all together is manual.
But, as college and university marketing departments mature, they face an increasing need to use data to back up decisions and demonstrate their impact. And, once a year will not do. This data needs to be made available on a more frequent basis.
Your Solution: The Marketing Dashboard for Higher Education
To take some of the pain out of collecting data, we’ve implemented – along with our higher education marketing clients – web-based dashboard tools. These tools can pull data from disparate data sources including:
-
Admissions CRM
-
Student information systems
-
Internal databases
-
Google Analytics
-
Marketing automation tools – Hubspot, Marketo, Evergage
-
Email tools – Constant Contact, Emma, MailChimp
-
Social media channels
-
E-commerce tools
Dashboard Tools Offer 3 Key Benefits
First, once set-up, these dashboards automatically load your data so it is always available. Second, these dashboard tools allow for comparison of data from different sources or systems. Third, they provide user-friendly reports and visualization that make data easy to share.
2 Types of Higher Education Marketing Dashboards
Even with easier access to reporting, the amount of data your systems may capture can be overwhelming. So, we recommend starting the process by thinking about your overall objectives. Broadly speaking, there are two categories of dashboards: output dashboards that capture the campaigns and other actions your marketing group is doing and outcomes dashboards that show how your work ties to business goals.
Marketing Output Dashboards
Output dashboards visualize and roll up the activity of your marketing department. They summarize your work, demonstrate engagement, and compare your efforts to internal and industry benchmarks. Elements can include:
-
Number of emails sent
-
Basic website traffic metrics – visits, bounces, session length
-
Social media follows
-
Social media content engagement – likes, retweets, favorites
-
Brochures sent out
-
Content produced
Here’s an example of an output dashboard from an SumAll — an online dashboard tool ($99/month). Here it’s pulling together counts for activity and engagement:
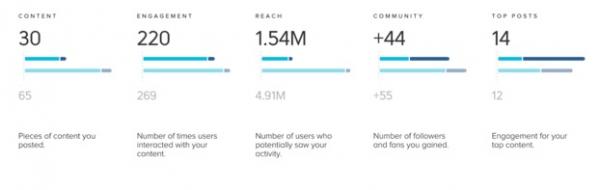
Output dashboards highlight your marketing effort and capture the overall “health” of your marketing activity. As your marketing department accumulates year-over-year information, you’ll be able to use this data to benchmark your performance and (hopefully) show improvement.
A more sophisticated view of output dashboards begins to layer multiple channels on top of one another. The goal of this exercise is to begin to explore correlations between data sources – for example, what happens to my website traffic if I use promoted tweets?
In these screens, we see that there’s very little correlation between social engagement and social reach and website page views (in orange).
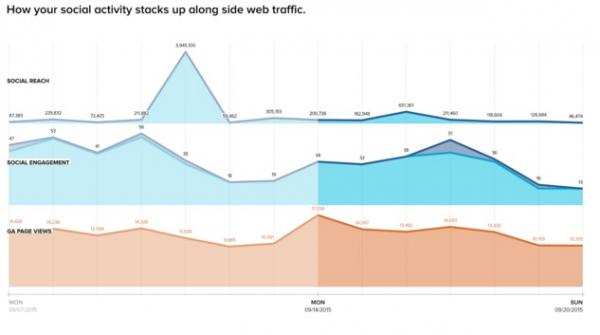
By allowing you to stack different data sources side-by-side, dashboard tools offer the opportunity to begin to explore your data, ask questions, and seek correlations.
Marketing Outcomes Dashboards
The first step toward creating an outcomes dashboard is to define a business goal with a metric such as:
-
Our goal is to to increase enrollment by 2%
-
Our goal is to increase completion of campus visit forms by 10%
-
Our goal is to increase requests for information by 25%
Often in higher education, marketers confuse tactics with business goals. For example, recent higher education website redesign RFPs have stated these tactics as “business goals”:
-
“The site needs to be responsive”
-
“Our goal is to implement a modern design”
-
“I want to enhance my brand”
-
“We want to implement marketing automation”
-
“We want to improve organic search results (SEO)”
While these may be important project goals, they aren’t business goals. To restate these tactics as business goals, they need to be tied to a metric: “Our goal is to increase enrollment by 2% by creating a responsive website.”
Once the business goal has been defined, the real work happens – finding a reliable data source that proves the outcome. We find that in higher education, clear business goals with good data require some real silo-busting:
-
It may mean reaching out to admissions to access their CRM data
-
It also may mean asking others to collect data on your behalf
-
You might need to start collecting new data as well
Figuring out if the data you want is already being captured or bringing the right people together to define a way to track it from end-to-end of a process is a big step. But, the results are worth it.
In this result, after 2 years of data tracking, one school is able to demonstrate a 19% increase in direct campus tour registrations resulting in more than 600 additional prospects.
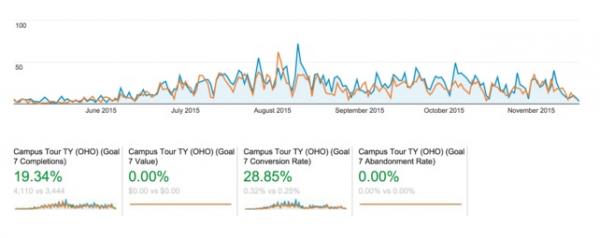
Armed with this conversion data, the marketing department can demonstrate the impact of their updates to the website. Plus, if they use our model for showing ROI, they can demonstrate how much revenue their work contributes the to bottom line.
Getting Started with Dashboards
Beginning to get meaningful data takes time. The first step is to start tracking as much as possible. Here are a few next steps:
-
Define what you can and want to track
-
Identify existing data sources even if they aren’t in your department
-
Start with counting your output and developing year-over-year benchmarks
-
Begin thinking about how to tie your work to the larger business goals of your college or university
Next-Level Marketing Reporting for Colleges, Universities and Higher Education
Once you’ve started tracking and analyzing your data, new questions will emerge. Using the raw data you collect, you can begin to string together data sources to build an end-to-end reporting system. Or, you can begin developing models that demonstrate ROI.