2019 Google Analytics Benchmarks for Higher Education Websites
An analysis of higher education web traffic data for 2018, highlighting industry trends dating back to 2014.
At the start of each year, we review website analytics data from a variety of colleges and universities to paint a broad picture of higher education website traffic trends. The data we reviewed spans from January 1, 2018 to December 31, 2018 and includes graduate programs, law schools, liberal arts colleges, universities, and adult programs. Whenever possible, we exclude internal traffic data to ensure the insights accurately convey the behaviors of prospective students, alumni, parents, and any other external visitors.
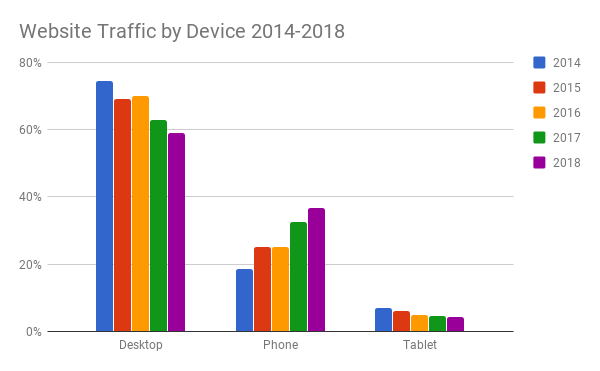
2018 Higher Ed Website Traffic by Device
Since we started tracking higher education website device data in 2014, we’ve seen a consistent shift away from desktop and tablet devices in favor of smartphones. Desktop traffic has dropped 20.3% in just five years – from a peak of 74% in 2014 to just 59% of device traffic in 2018. Higher education website traffic dropped on desktop browsers in 2018 with the traffic decreasing 4% from 63% in 2017 to 59% in 2018.
Conversely, smartphone use has increased by a staggering 92.6% in the last five years — up from 19% in 2014 to 36.6% in 2018. If the trend continues, we could see smartphone use outpace desktop devices as soon as 2021 or 2022 — and even sooner if the trend accelerates.
While it’s true more visitors are opting for mobile devices, that doesn’t necessarily translate to tablet use. Similar to desktop, tablet traffic has steadily declined year over year, accounting for just 4.4% of visitors in 2018 — a 12% drop from the previous year and a 41.33% drop from the 2014 high of 7.5%.
Higher Ed Website Visitor Engagement
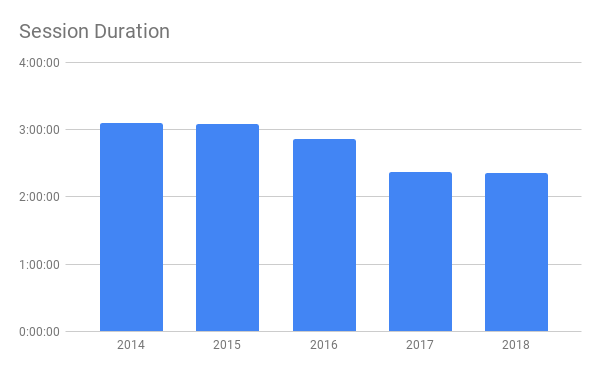
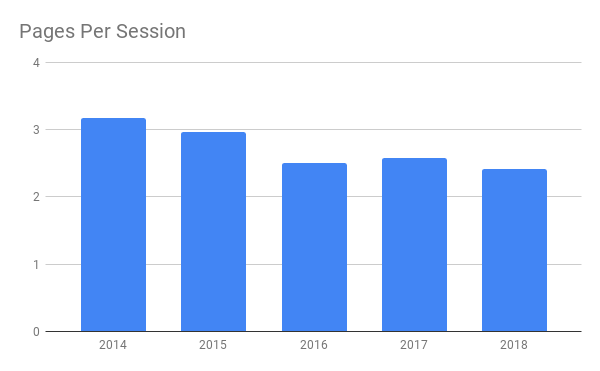
When trying to gauge user engagement, three of the most popular metrics schools turn to are session duration, pages per session, and bounce rates. Traditionally, longer sessions, with more pages per sessions, and a low bounce rate implies higher user engagement. In higher education, all three metrics are continuing to trend in the wrong direction.
While not as drastic as the decline in desktop use, visitors to higher education sites have been spending less and less time during their visits — and visiting fewer pages. Since 2014, the average session duration has dropped from 3:06 to 2:21, and the number of pages per session has dropped from 3.18 to 2.42.
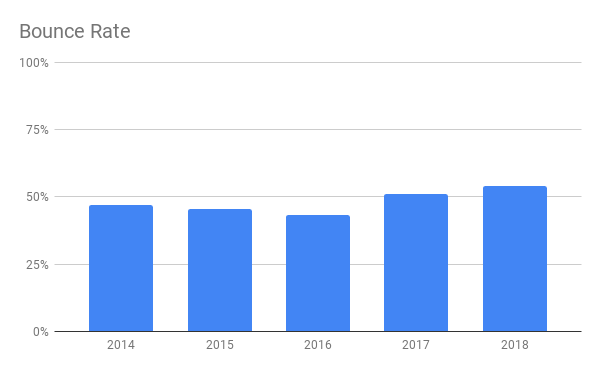
Bounce rate has historically been more stable than the other datasets we track, and was gradually declining from 2014 to 2016...until last year when it rose significantly from 43% to 51.26%. In 2018 it continued the trend reversal and increased to 54%.
2018 Higher Ed Website Analytics Data: What Does This All Mean?
The shift from desktop to mobile in higher education is not a surprising one, nor is it something to be fearful of. As a whole, website visitors from mobile devices overtook desktop users back in 2017; higher education actually has an abnormally high prevalence of desktop users.
If you are still taking the “desktop first” approach for your higher education website, now is the perfect opportunity to start thinking about a “mobile first” strategy instead. Desktop is still king in higher ed, but it’s superiority is beginning to wane. Digital marketers need to pay attention to website performance and content presentation on mobile and desktop equally.
While the continued decline in session duration and pages per session might seem concerning, the trends highlight a clear and compelling need to create pointed, personalized content that conveys the right message, at the right time, to the right person. With users spending less time engaging with less content, digital marketers can’t take the “shotgun approach” and hope that something on the site will catch users’ attention. Content needs to be relevant, targeted, and conversion driven.